
Where the Dollars Went: A Look at Staffing Growth
Eanes ISD is confronting a budget deficit that is widely discussed in the $5.0–$6.0M range.
When individuals ask me, “Catherine, how did a wealthy district like ours end up with a budget deficit?” up until now, I have not had a concrete set of facts to offer.
After reviewing nine years of publicly available budget data, here is what I found: approximately $4.6 million of our current salary spending reflects structural staffing-model changes beyond approved pay raises since 2017–2018.
That matters.
Robin Hood and recapture unquestionably constrain district revenues. This post does not analyze revenue; it examines costs. Deficits rarely emerge from a single cause. More often than not, it is a slow accumulation of choices that felt reasonable in the moment, one position here, a re-org there, a new managerial role somewhere else. Over time, those choices compound.
When a school district faces a financial gap of that size (i.e., millions of dollars), the conversation often turns immediately to painful options: larger class sizes, program reductions, fewer electives, or compensation pressures. If you’ve been paying attention to Board meetings recently, you’ve heard us Trustees debate those very same topics.
However, as we consider future budget decisions, it will be important to examine the areas where structural growth has been most concentrated.
I am a CFO by profession, and I ran on a commitment to approach our budget challenges with transparency and financial rigor. This review reflects that commitment. Using publicly available information, I examined how salary spending has changed year over year.
Because more than 85% of our operating budget, net of Robin Hood, goes to payroll, this analysis focuses on a straightforward question:
How much of our payroll growth is explained by approved annual pay raises, and how much reflects structural changes to the staffing model?
Stated differently: if we held the 2017–2018 staffing model constant and applied only approved raises year after year, what would payroll look like today? How does that compare to what we actually budgeted?
After I completed my analysis, I had to consider how to best convey these findings in a way that will keep you, the reader, engaged. What looks like a clean spreadsheet to me (yes, I do love a good Excel model) can look like a confusing jumble of numbers to everyone else.
This analysis reflects my individual review of publicly available data and is not an official position of the Board. Trustees may approach governance with different perspectives. My view is that effective oversight requires multi-year trend analysis, forward-looking projections, and clear visibility into structural cost drivers.
With that context, here is the scope of my analysis.
Scope: what this analysis covers, and what it does not
To keep this write-up clean and defensible, I pulled my data from publicly available sources, including district budget documents, board-approved compensation schedules, and local reporting on annual pay raises dating back to the 2017–2018 school year. I chose 2017–2018 because that was a school year not impacted by COVID-19. I then looked at every budget year since, up to the current budget for the 2025–2026 school year.
Included in this write-up:
Headcount-related payroll costs, using salary line items.
A table, showing year-over-year changes by function.
A roll-forward model that begins in 2017–2018 and applies the Board-approved annual pay raises each year.
The model estimates what payroll would be today if the staffing model had remained the same as in 2017–2018.
This analysis only looks at the salary costs, and does not dive into other Budget categories such as Services, Supplies, or Other Expenditures. For now, I intentionally isolated salaries so we can see the staffing story without noise.
I should also point out that I do not presently know if benefit costs such as retirement and insurance costs are embedded in the salary line items. If they are, then those costs would be scaled in my analysis by the amount of the annual pay increase. Suffice it to say, I believe this analysis is directionally correct, but I do not have access to the underlying details to make this fully accurate, down to every penny.
The method: separating staffing levels from pay increases
Payroll typically changes for two reasons:
Changes in the payroll schedules: the cost of a given position increases over time due to raises, market adjustments, step increases, stipends, or changes in pay structure.
Changes in the number of staff: the number of positions changes (i.e., FTE increases, new roles, additional layers, staffing reallocation).
My Methodology:
Step 1: Establish a baseline year
I used 2017–2018 as the starting point for salary costs by function. Again, this was a few years before COVID-19 impacted our school district.
Step 2: Build a table showing budgeted salary costs year over year
I used the following table to examine where costs increased the most from 2017–2018 to the current budget year.
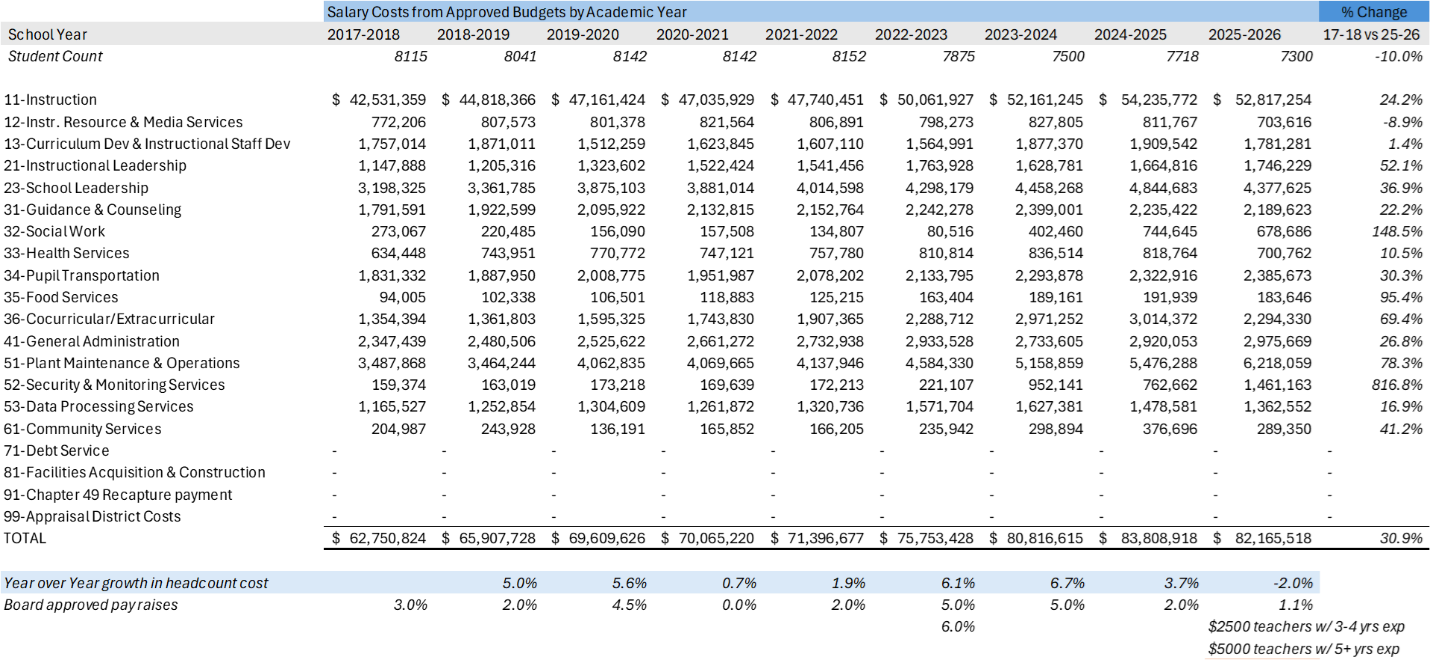
Now, let me help you see what I see.
In the far right (last) column I calculated the change in salary costs from 2017–2018 to 2025 –2026. Scan your eyes down that column of percentages, and you will spot that some staffing costs grew, one area actually shrank, and some grew more than we might expect.
Look at the row labeled “52 - Security & Monitoring Services”. That’s our new Police Department. It makes sense that this would grow, given that we didn’t have a police force back in 2017–2018.
I also included two rows at the bottom of the table to show how gross salary costs changed over time - that’s the year over year percentage change. I also included the Board approved pay increases for the same period.
Can you see where in some years our payroll costs grew more than the approved pay raises?
This is where I wanted to understand more.
Step 3: Build a table to show where salary costs grew by function year over year.
So now that we’ve looked at the change from 2017–2018 versus the current budget year, let’s take a look at what changed from year to year.
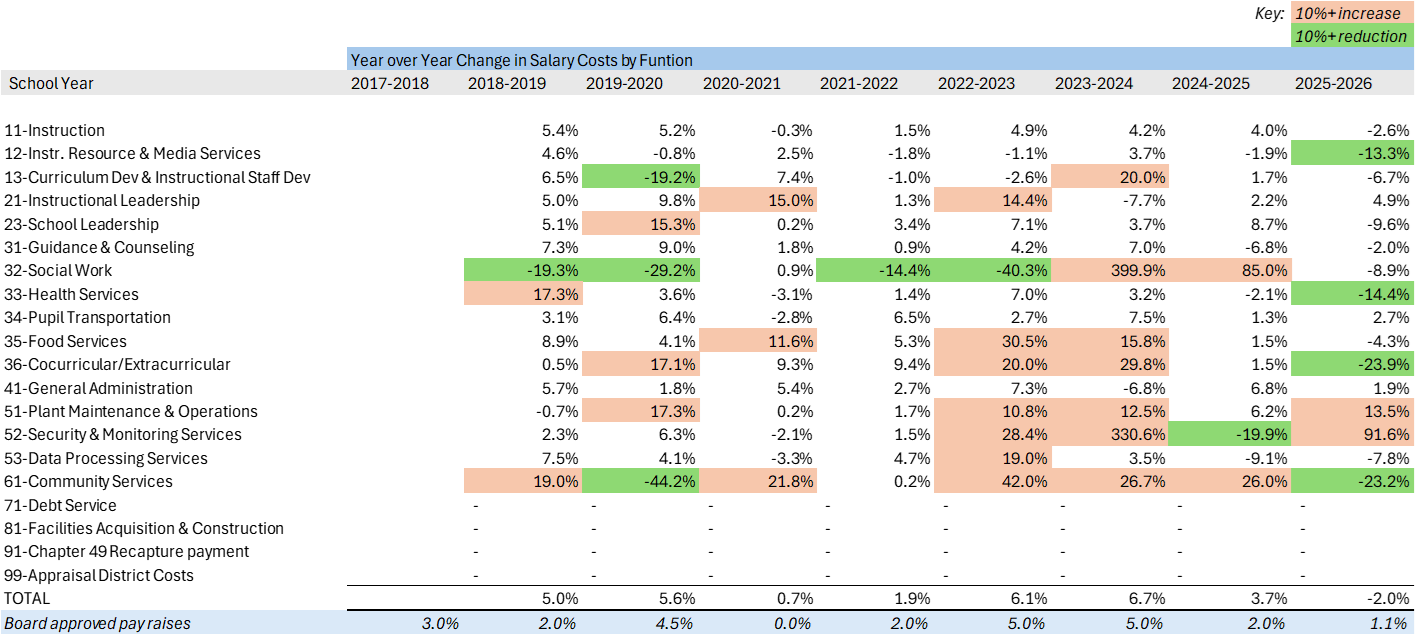
The peach colored cells show year over year changes where costs increased by more than 10%, and the green cells show where costs decreased by more than 10%.
Why 10%? I wanted to visually highlight the outliers in this table, to see if any larger items jumped into view. 10% seemed like a reasonable number to start with.
The colors help us spot some interesting details. Remember, these are all staff/payroll costs. Behind every dollar increase is a person, many of whom we know by name, doing work on behalf of our district. It is logical to conclude that staffing must have grown in some of these areas, because the salary increases alone can not explain all of the growth in certain areas.
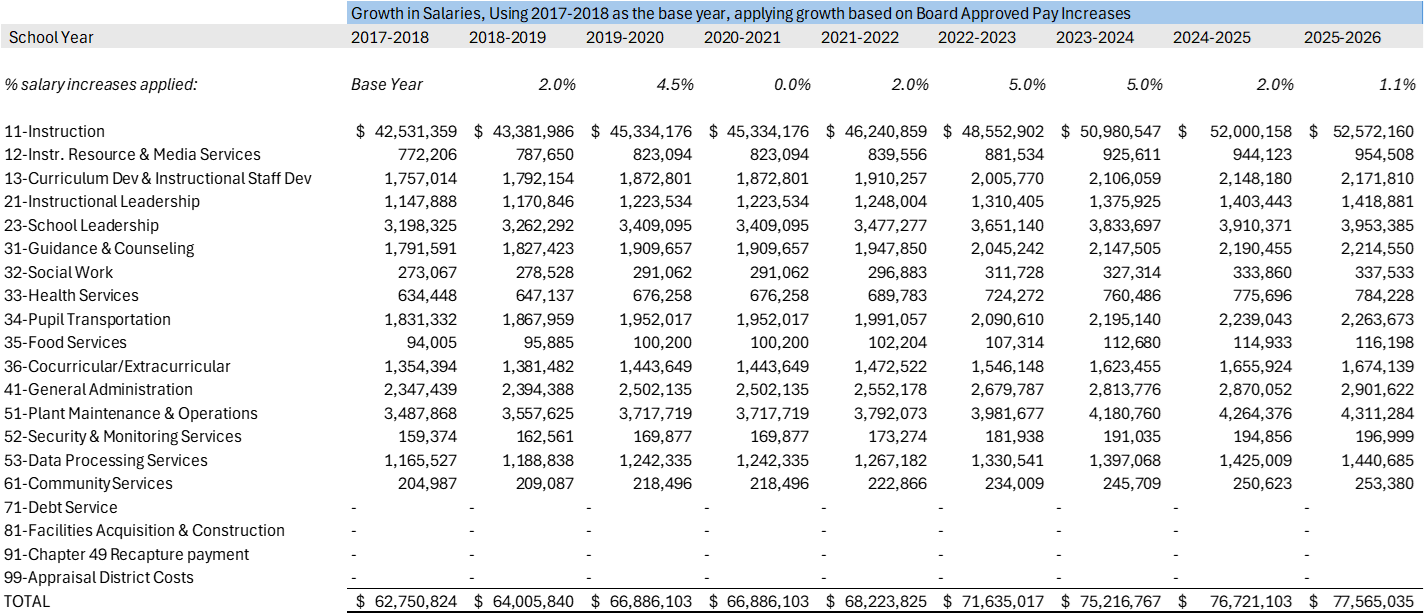
Step 4: Apply a “raise-only” roll-forward, starting at the base year
Next, I wanted to understand what payroll costs would have looked like if we applied the Board approved annual pay raises after 2017–2018 and applied them year by year from the starting point until we reach the current year.
Have I lost you already? I hope not – stick with me….
The raise assumptions in the roll-forward are:
2018–2019: 2.0%
2019–2020: 4.5%
2020–2021: 0.0%
2021–2022: 2.0%
2022–2023: 5.0%*
2023–2024: 5.0%
2024–2025: 2.0%
2025–2026: 1.1%*
Some footnotes:
For 2022–2023 the Board approved 5% raises for salaried staff and approved 6% raises for hourly staff – for simplicity I used 5% for my analysis, since teachers are considered salaried staff.
For 2025–2026 the Board approved $2,500 increase for teachers with 3-4 years of experience, $5,000 for teachers with 5+ years of experience, and 1.1% increases for teachers with 0-2 years of experience and all other roles. For simplicity I used 1.1% for my analysis.
Here’s what that looks like in table form:
Step 5: Compare “raise-only” to the actual 2025–2026 approved budget
The difference is a proxy to help us see if there was a staffing model change over that time period, which could include added positions, expanded departments, reclassifications, or other structural growth beyond raises.
Compounded together, the Board approved raises over the past 8 years would organically grow salary spend about 23.6% from the 2017–2018 baseline, presuming that staffing levels stayed flat. Meanwhile the Budget for salaries actually increased by 30.9% over the same time horizon. 7.3% of the increase in our salary budget is explained by something other than annual pay increases.
Some readers may reasonably point to inflation as a driver of rising costs; however, because this analysis focuses specifically on salary expenditures and already incorporates board-approved pay increases (including larger adjustments during higher-inflation years) general inflation is largely reflected in the raise assumptions and does not explain the remaining structural variance.
The table below is the same one from above with added columns and rows to show the “raise-only” model versus the approved current year budget.
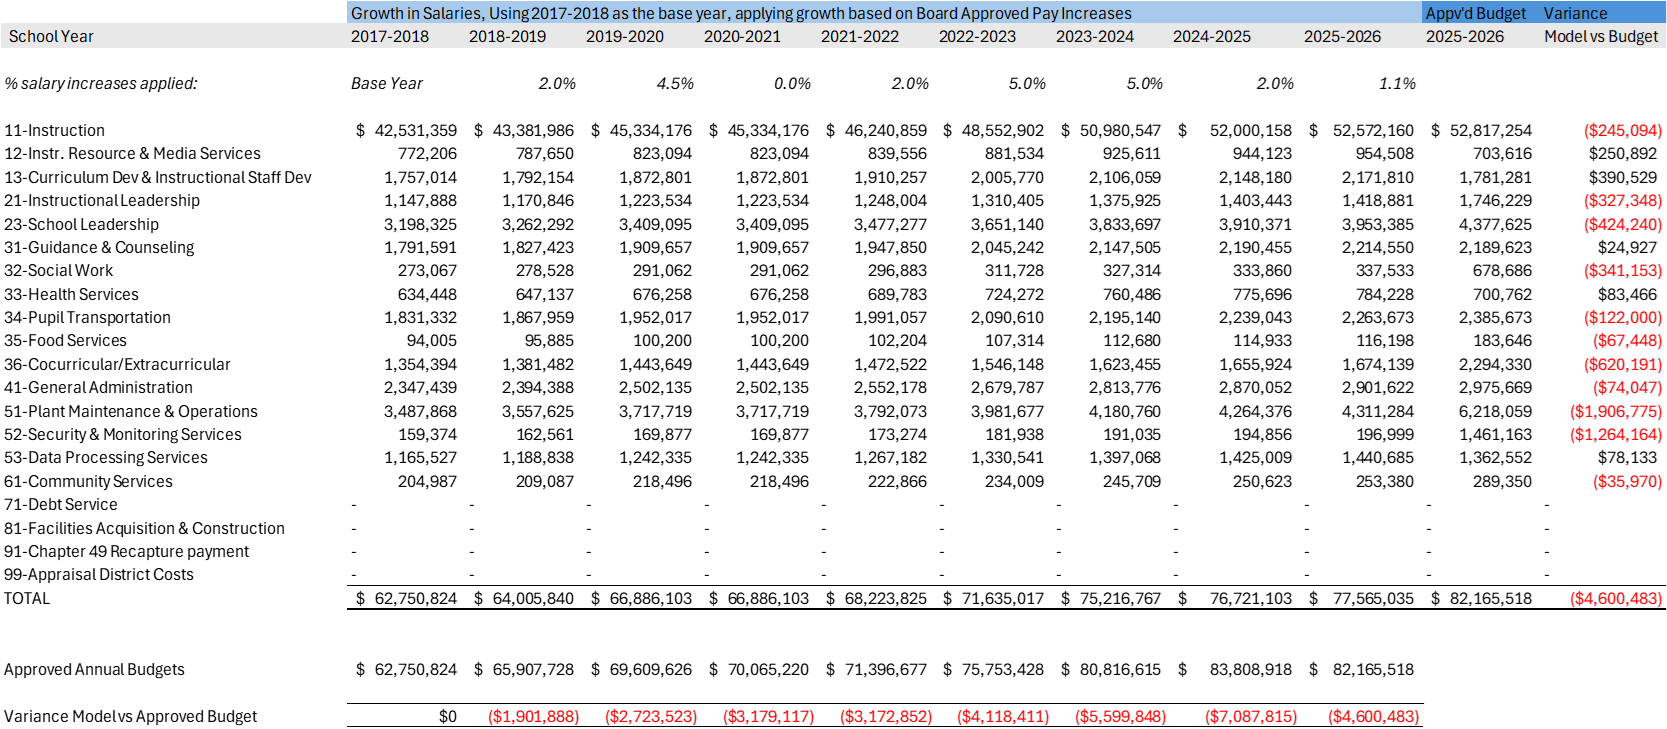
The red text in the table shows us where the “raise-only” scenario would have been lower than the approved Budget.
For example, in the current budget year, our salary budget was approved at $82.17M
If we had kept the 2017–2018 staffing structure and applied only the approved raises, salary costs would have been about $77.57M
That’s a difference of $4.60M.
That $4.60M is the critical number. When the Board approved the current year’s budget last June, the projected deficit was $7.1M. ]
For the upcoming 2026-2027 school year the Board is still wrestling with a $5.0–$6.0M deficit. This number is not far off the staffing-model variance.
Where structural growth is most concentrated
District budgets and staffing models evolve over many years through Board-approved decisions and administrative implementation. This analysis is not a critique of any individual, but an examination of structural trends over time.
Here are the largest cost drivers:
Plant Maintenance & Operations: +$1.91M
Second-largest structural increase beyond raises
Possible drivers: aging facilities, added square footage, shifts from contractors to in-house staff, service-level changes
Represents nearly 41% of the total $4.6M variance
Governance Questions:
What specific operating model changes drove this increase?
What measurable service standards improved as a result?
What is the multi-year financial plan to sustain this higher baseline?
Security & Monitoring: +$1.26M
Driven largely by the 2023 state mandate requiring an armed officer on each campus
District formed a Police Department in June 2023
State safety allotment (~$10 per student + $15,000 per campus) provides just over $100,000 annually, a small fraction of total recurring cost
Police staffing now represents a permanent structural cost baseline
Governance Questions:
What is the full recurring annual cost of the Police Department, including vehicles, supervision, training, and equipment?
What portion is offset by state funding versus local funds?
What is the long-term sustainability plan for this mandated expense?
Cocurricular/Extracurricular: +$0.62M
More than doubled from ~$1.35M (2017–2018) to ~$2.29M (2025–2026)
Includes stipends for coaches, athletic directors, fine arts directors, trainers, coordinators, and program support
Growth occurred while student enrollment declined approximately 10%
Governance Questions:
What programs or roles were added, and when?
Has participation growth justified the added recurring payroll?
Are stipends and staffing aligned to current enrollment levels?
Leadership Layers combined +$0.75M: Instructional Leadership: +$0.33M and School Leadership: +$0.42M
Structural growth in leadership roles beyond raise-only projections
Leadership roles, once added, tend to persist and often create additional coordination layers
Governance Questions:
How many leadership positions have been added since 2017–2018?
Were these additions tied to defined outcomes, and were results measured?
Are leadership ratios aligned with campus size and declining enrollment trends?
Social Work: +$0.34M
Significant increases in 2023–24 and 2024–25
Likely reflects rising post-COVID student needs
Represents meaningful but smaller portion of total variance
Governance Questions:
What caseload and demand indicators drove expansion given our 10% enrollment decline?
How is social work coordinated with counseling, SPED, and crisis response?
Are service levels and outcomes being tracked to ensure targeted allocation?
Path Forward: Transparency, Discipline, and Stewardship
Budgets are an organization’s values expressed in dollars. Over time, those dollars tell a story.
After reviewing nine years of data, the story here is clear: board-approved raises explain expected payroll growth, but approximately $4.6 million of current salary spending reflects structural staffing-model changes beyond raises. That does not imply wrongdoing, nor does it diminish the value of the people behind those positions. It does mean that structural decisions made over the past eight years now carry recurring financial consequences.
When I ran for Trustee, I committed to approaching our budget challenges with transparency and financial rigor. This analysis is part of that commitment. Sustainable budgets require recurring positions to be added deliberately and re-evaluated periodically. (Even those of us who enjoy a good spreadsheet understand that every line item represents real people and real priorities.)
To keep this discussion factual and forward-looking, I believe the district should adopt a small set of structural guardrails:
Annual Staffing Transparency Package published with the budget, including multi-year FTE counts by function and campus, net new positions with rationale and recurring cost, and clear explanations of function code changes.
Annual Police Department Report detailing FTE counts, total recurring cost, state safety funding offsets, and a multi-year sustainability plan.
Multi-Year Financial Impact Requirement for all new recurring positions before approval.
Enrollment-Based Guardrail: During enrollment decline, non-instructional payroll growth should not outpace instructional payroll without explicit public board discussion and documented rationale.
Trustees may approach governance with different perspectives, and that diversity of thought is part of the role. My objective is not to win an argument, but to ensure we are making decisions from a shared fact base. If we remain disciplined about structural costs and transparent in our reporting, we can protect what matters most.
That is: strong classrooms, competitive compensation, and a financially sustainable district.
As you continue to have dialogue with your friends, neighbors, fellow parents, and school administration, I encourage you to ask for more transparency in reporting, just as I will be doing.